
 ECE 2036 Lab 3
BACKGROUND
 For
For
this lab, you will analyze car racing data provided by Racing Analytics, an
Atlanta-based company:
http://www.racinganalytics.com
Racing Analytics collects and analyzes data in order to
measure and improve the race performance of their clients. The data provided is from a spec Mazda Miata
racing at Road Atlanta:
http://www.roadatlanta.com/trackmap.lasso
The original datafile (*.tqm file) is provided with the lab materials. If you wish to view it using the Traqview software on a PC, the software may be downloaded
from
http://www.traqmate.com/downloads/traqview/TraqviewSetupReleaseV3.00.exe
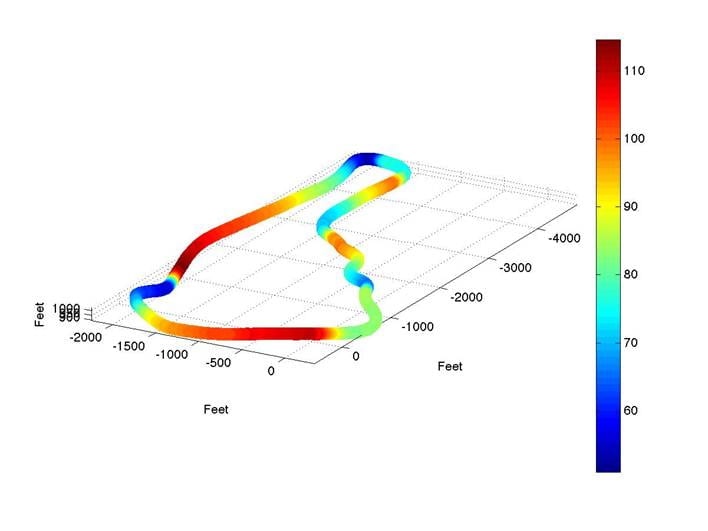
We have taken this data and split it into a separate
comma-delimited file for each lap, named lap# where # is the lab number. These files may be loaded in Matlab for easy visualization. For example, below is shown a scatter3 plot
of speed in MPH vs. position and altitude for lap 10.
TASKS
The code you write must create a class called Lap which is
designed to store lap data and provide public member functions for reading in,
analyzing, and outputting the data. Your
code must prompt the user for the first lap and the last lap to analyze (for
example, first lap = 2, last lap = 5). A
separate object of class Lap must be instantiated for each lap. Your code must then open the datafile corresponding to each lap in the specified range
(files lap2, lap3, lap4, and lap5 for our example) and read the data into a 2d
array which is a private data member of class Lap. Each line of the lap data file contains data
in the following order:
GPS Reading, GPS Time, GPS Weeks, Elapsed Time, Lat (Degrees), Lon (Degrees), Lat
(feet), Lon (feet), Altitude (feet), Temperature (degrees F), EastVel, NorthVel, VertVel, Velocity (MPH), Heading(Deg),
XGs, YGs, RPMs, D4, D5, A0, A1, A2, A3, Gear, Brake (calc),
Accel (calc),
Many of these variables are self-explanatory. XGs and YGs provide two vector components of
the g-forces the car is subjected to.
D4, D5, A0, A1, A2, and A3 are unused.
Brake(calc) is 1 when
the brake is applied and 0 otherwise, Accel (calc) is 1 when the accelerator is applied and 0 otherwise.
Because each lap was completed in a different length of
time, each lap data file contains a different number of lines, which your code
must count. After reading in the lap
data files, your code must provide the following outputs:
·
Time elapsed during each lap, sorted from
shortest to longest and labeled by lap
number (20 points)
·
Average speed in MPH during each lap, labeled by
lap number (10 points)
·
Percent of lap duration spent pressing the
accelerator for each lap, labeled by lap number (10 points)
·
Highest speed and lowest speed in MPH for each
lap, labeled by lap number (10 points)
·
A comma-delimited data file containing the
approximate acceleration along the driving direction in MPH/s along with the
corresponding latitude and longitude in feet for each point in the lap,
obtained by calculating the derivative of the speed data with respect to
time. The file will be named lap#accel, where # is the lap number. (20 points)
Note: Use the finite difference
approximation to calculate the derivative:
a=
dvdt≈vt+∆t-vt∆t

where
a is acceleration and v is velocity (speed).
Using this, we can say
ai≈vi+1-viti+1-ti

where
a, v, and t are arrays representing the acceleration, velocity, and time,
respectively, and i is the integer index labeling each
data point in the arrays (i = 0, 1, 2,
). This is only accurate if the time step is
small.
Driver and car performance in
turns is of particular interest to drivers and crews. In addition to the above, we will analyze one
turn in detail. The turn we will analyze
is the north-easternmost turn seen in the Google Maps view of the track. It may be identified as having GPS latitude
> 34.1475 degrees, and longitude > -83.81041. For this turn in particular, your code will
provide the following outputs:
·
speed in MPH at exit of turn for each lap,
labeled by lap number (15 points)
·
speed in MPH at entry of turn for each lap,
labeled by lap number (15 points)
You will be provided with the lap data files for laps 1-10
as well as the expected output for these laps for code testing purposes. Your code will be graded using lap data files
for laps 11-20, which you will not be provided in advance.
LAB MATERIALS
Click here to download .zip of lap files, .tqm file, and skeleton code: (note that the lap files must be placed in the project directory with the source code) http://users.ece.gatech.edu/~bklein/2036/files_for_lab3.zip
Expected program output for laps 1-10:
bash-3.2$ ./a.out
Enter first
lap: 1
Enter last
lap: 10
Sorted lap
numbers, time (s), average speed (mph), percent of lap accelerating, highest
speed, lowest speed, turn entry speed, turn exit speed:
7, 106.1, 85.9465,
77.2856, 115.651, 50.9352,
88.2709, 89.1299
9, 106.175, 85.7244,
77.8432, 115.794, 50.6257,
87.6558, 90.0947
5, 106.375, 85.6019,
77.0388, 118.245, 46.6473,
88.3386, 92.9353
6, 106.925, 85.1735,
76.8997, 114.674, 49.5438,
89.8754, 89.8422
4, 106.925, 85.1969,
76.6191, 116.704, 51.5302,
87.3402, 88.2564
8, 107.15, 85.0444,
76.3649, 114.835, 50.6284,
88.1647, 89.1233
10, 107.6, 84.6109,
79.1822, 114.662, 50.9818,
82.8213, 84.2125
2, 109.075, 83.5438,
74.3067, 114.183, 49.9965,
85.8779, 83.4166
3, 109.475, 83.1213,
76.0904, 117.13, 48.9904,
83.3789, 84.1368
1, 115.275, 79.0689,
71.6981, 113.44, 45.9791,
66.1726, 69.7166
Output acceleration data files may be downloaded here: http://users.ece.gatech.edu/~bklein/2036/accel_files.zip
Lab checkoff sheet: http://users.ece.gatech.edu/~bklein/2036/Racing_Analytics_Checkoff_Sheet.docx
SUBMISSION AND
GRADING
This will be graded by demonstrating for the TA (checking
off) OR by submission on Jinx. Early submissions/ check-offs
are awarded 2 bonus points per day early.
Late assignments are penalized 20% per day late. If you are unable to demonstrate for the TA
by the due date and time and wish to avoid the late penalty, either submit on Jinx (directions below, no demonstration required) or upload a zip of
all of your code files to t-square before the due
date and time, and ask the TA to download it when you arrive for your
demonstration. Only one official
demonstration or Jinx submission is allowed per student: after you have completed your graded
demonstration or Jinx submission you will not receive additional points by demonstrating
additional features later.
Directions for project submission on Jinx: http://users.ece.gatech.edu/~bklein/2036/Directions_for_project_submission_on_jinx.pdf
Special thanks to Darren Pierce and Jay Stroud
of Racing Analytics for providing the racing data.